


.jpg)


.jpg)


%20(1).jpg)


.png)


.jpg)


The Most Common Partnership KPIs (According to Company Size and Maturity)


We surveyed more than 170 partnership professionals to help you get an idea of which KPIs to measure and when.

You’re just about to get your partnership program off the ground, and the KPI you’re held most accountable for is “new partnerships created.”
Flash-forward to 50 hires and 30 new partners later, and you’ll instead be held accountable for partner-sourced revenue.
Want to know how we know?
In our 2021 State of the Partner Ecosystem Report, we found that partnership professionals prioritize different combinations of KPIs at different company sizes. This analysis played into our hunch that KPI trends correlate with partner program maturity (and maturity tends to go hand-in-hand with company growth).
With this data in our arsenal, we want to help you forecast which KPIs to prioritize and when (plus, how to set yourself up for success).
Let’s start by defining common partnership KPIs (or skip ahead to view our KPI heat map).
A Quick KPI Glossary
There’s no standard manual for partnerships, and there’s certainly no “rights and wrongs” for partner lingo. That said, we gathered the typical KPI nomenclature we’ve heard through our conversations with people like you.
Common partnership KPIs:
- Partner-sourced revenue (🏆the most common KPI for partnership professionals 🏆) is direct revenue from any deal attributed to one or more partners 100% responsible for bringing the account into your pipeline (the deal wouldn’t exist without their help 🙌). Think of an ecosystem qualified lead (EQL).
- Partner-influenced revenue is indirect revenue from any deal attributed in part to one or more partners. (Think: when your partners help your sales team accelerate, increase the deal size of, and close your in-progress deals).
- Number of new partnerships. Straight-forward enough, right? Especially when you’re in the beginning stages of launching a new partner program, the number of partnerships with the right partners can help to establish your company’s position in the ecosystem.
- Number of leads generated by partners is the amount of net new accounts your partner generates for your company — whether through brokering introductions between your sales rep and account stakeholders, by contributing registrants to a webinar you co-hosted, or generating demo registrations through your listing on their app marketplace (and so on).
- Number of opportunities influenced by partners is the number of opportunities your partner helped to qualify (Think of all the leads your partner shared information about regarding budget, key stakeholders, and other context to help your team mature them to the opportunity stage).
- Number of opportunities sourced by partners is the number of qualified opportunities your partner sourced (Think of the “number of leads generated” KPI and how many of those leads matured to unique opportunities).
Unveiling Our KPI Heat Map
With the data from our 2021 State of the Partner Ecosystem Report, we developed a KPI heat map to track the most common partnership KPIs according to company size and partner program maturity.
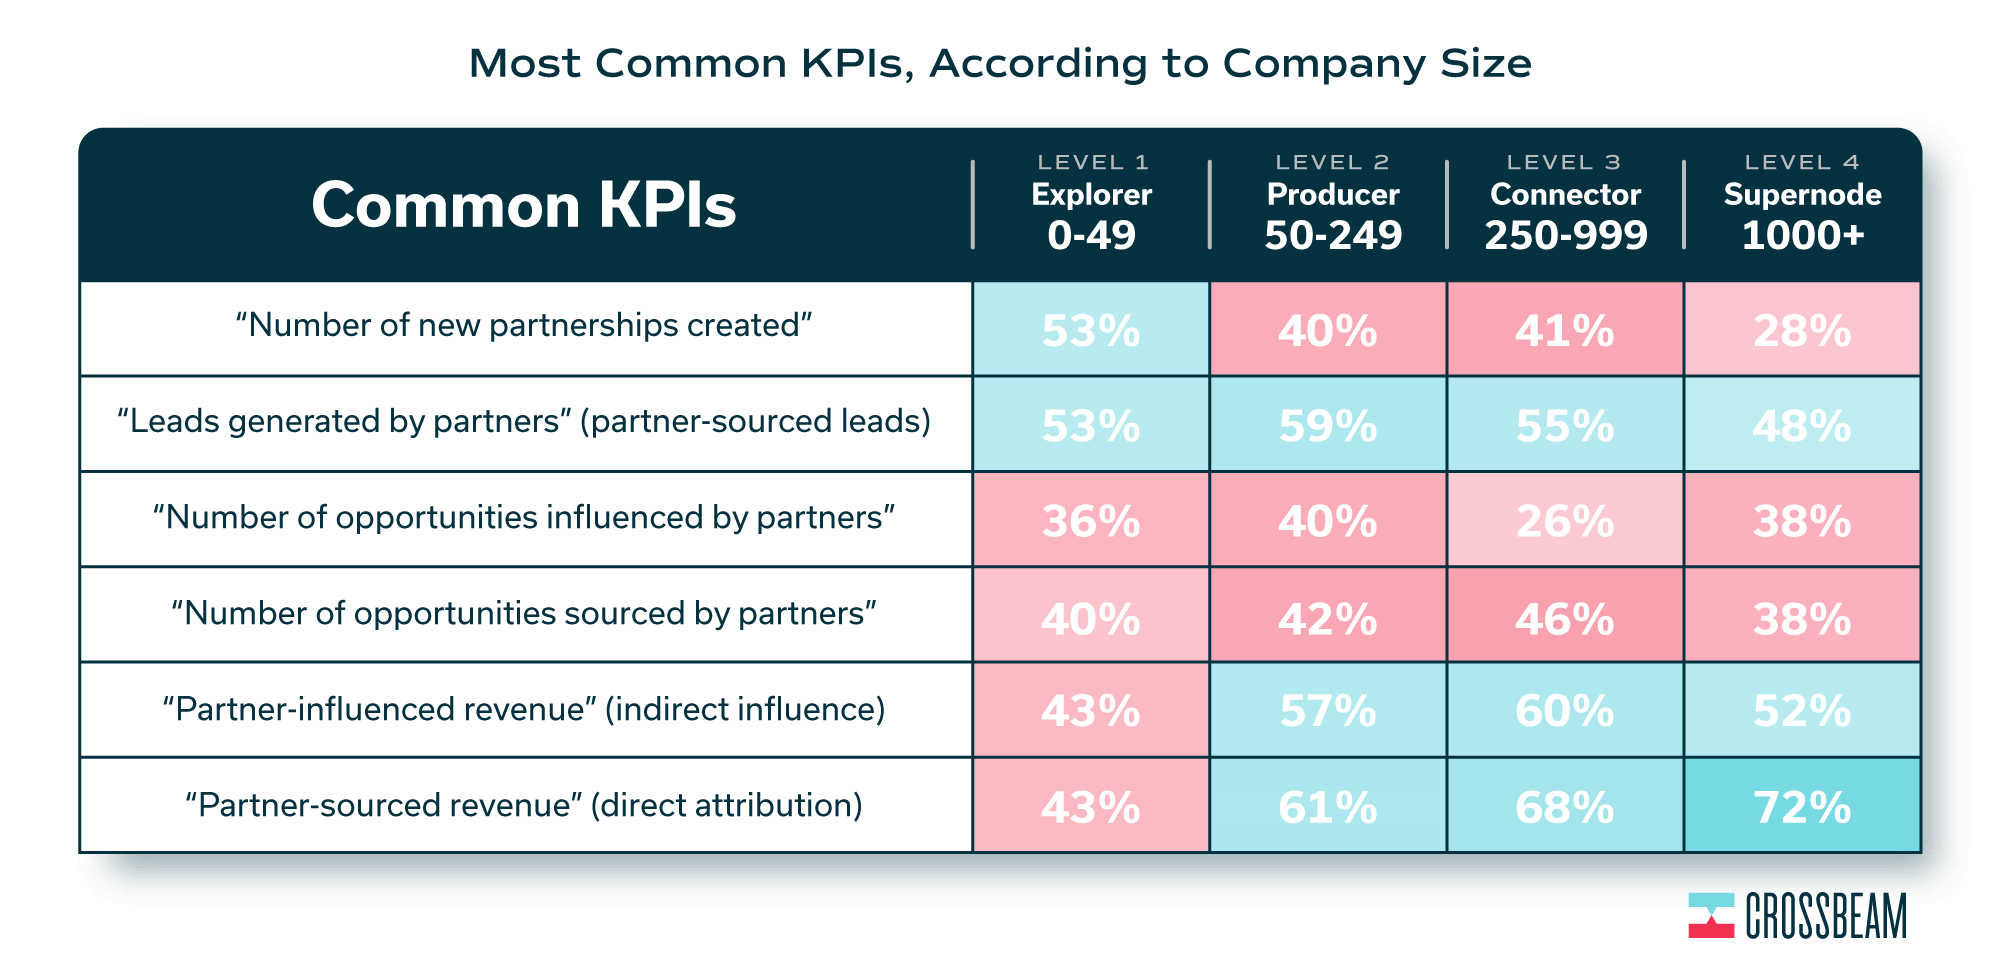
Through our KPI heat map, we uncovered some interesting trends. On the left-hand side, for instance, you’ve got companies at the 0-49 employee count. These companies tend to prioritize metrics like “number of new partnerships.” All the way on the right, you’ve got supernodes at more than 1,000 employees prioritizing “partner-sourced revenue” first and foremost.
We noticed that KPIs have “seasonality”. Some KPIs, like partner-sourced revenue, come into the picture at specific turning points in company growth and maturity — while others phase out as they become less relevant. To show this KPI seasonality, we identified four levels of partner program maturity and the KPIs you should prioritize in each.

Level #1: Explorer
Your team of 0-49 employees is in an early stage of fast growth. Kicking your partner ecosystem off the ground with a bang becomes a priority. You need to establish your company’s position in the ecosystem while discovering the best way to do it. You’re conducting market research, discovering early development processes with new partners, and launching your first strategic partner program. This is a time for setting your company up for success while experimenting, adapting, iterating, and reacting to an initial wave of partner requests as a team of one.
Maybe you’re measuring early results, but you know partnerships are a long game. The true ROI — revenue — is yet to come.
At “level 1,” the majority of your peers are held most accountable for:
- Leads generated by partners (53%)
- Number of new partnerships created (53%)
Quick Tips:
- Prove that your partners are bringing value to your organization with bite-sized results. For instance, maybe your new partner brokered five warm introductions for your sales reps or the webinar you co-hosted generated 30 net new leads.
- Know that what works now may not work as well later as your company grows and alignment between internal and external stakeholders becomes more challenging. Invest in some Ecosystem Ops now to help you manage your workflow and documentation in a way that may be repeatable for future hires.
Essential reading for making the most of “Level 1” 👇
- Your Partner Tiers Cheat Sheet: Benefits, Drawbacks, and Checklists. You likely don’t have time to invest in an official, public-facing, fully-functioning tiering system just yet – but you should identify some less-official-but-equally-important buckets to help you prioritize incoming partners and manage work for your internal teams. Plus, you can use our partner tiers cheat sheet to map out your official partner tiers when the time comes.
- No Channel Team? No Sweat. Your Sales Reps are Channel Managers in Disguise. As a partnerships team of one (at first), you’re going to need to support and rely on help from your sales team for channel sales. Here’s how Greg Unruh at Shipware empowers his outbound sales reps to assume the role of a channel sales team.
- Your Partner Vetting Checklist: 7 Questions to Ask Before Signing an Agreement. With little time and a very small partnerships team (hey, you 👋), you’re going to want to vet every partnership opportunity before going all in.
- 9 Micro Co-Marketing Motions for Warming Up a Partnership. On the topic of vetting, start small with your co-marketing motions to test the waters, iterate, and decide how to move forward together (or not).
- Crawl, Walk, Run: The Co-Marketing Framework That Will Keep You Sane. Start small with some of the micro co-marketing motions above to measure results and build muscle. Then, think bigger.

Level #2: Producer
At anywhere from 50-99 employees, you’ve got a core set of partners moving things along. Your company’s growing quickly, and so is your partner program. The DIY partner enablement, one-off request to the marketing team, or impromptu Slack messages with the sales team isn’t quite cutting it (Psst! Crossbeam’s Slack App can help with that 😉). What worked before is now falling apart.
With your program up and running, the KPI “number of new partnerships” begins to phase out. From here on out, get ready to measure revenue.
At “level 2,” the majority of your peers are held most accountable for:
- Partner-sourced revenue (61%) (Well, hello there!)
- Leads generated by partners (59%)
- Partner-influenced revenue (57%) (Oh, you’re here, too?!)
Quick Tips:
- Invest in tools like partner ecosystem platforms (PEPs) like Crossbeam to help your surface overlapping prospects, opportunities, and customers with your partner in real-time
- Invest in tools like partner relationship managers (PRMs) to help you attribute deals and revenue to specific partners
Essential reading for making the most of “Level 2” 👇
- The Rule of 99: Why Partnerships Get Complicated at the 100-Employee Mark. At the 100-employee mark, there tends to be a growth spurt for the number of partners and number of partner-focused employees. This when everything tends to break.
- The Co-Marketing Flip: Get Strategic With Your Partner Marketing Six Months Into a Partnership. Mike Stocker at RollWorks shares his Partnership Maturity Curve, which details when to get strategic with your co-marketing with tech partners.
- Ecosystem Ops 101: 6 Ways to Drive Efficiency and Maximize the ROI of Your Partner Program. Invest in a set of repeatable practices for streamlining your co-selling workflows, partner enablement processes, and more.
- 5 Tactics You Can Use Right Now to Show the Real-Time Impact of Partnerships. Showing the real-time effects of partnerships can help you get the buy-in you need from your sales, product, and leadership teams. We gathered five tactics partnership professionals like you use to do just that.
- 2 Attribution Challenges for Partnership Professionals (and How to Get Ahead of Them). Attribution is an ongoing challenge year over year, so we spoke with partnership professionals to hear their tips and tricks for tying partnerships to results. We even included a “sales and partnerships alignment for attribution” infographic.

Level #3: Connector
If you’ve identified your needs for Ecosystem Ops in “level 2” and invested in the tools, processes, and new hires to move your program forward, you’ve set yourself up for success. At the 100-999 employee mark, you should consider your partner program “mature.”
To support that maturity, partner-sourced revenue becomes a top priority. That means you’ve got to have a strong foothold on driving results, measuring those results, and empowering internal and external stakeholders on helping you meet your KPI goals.
At “level 3,” the majority of your peers are held most accountable for:
- Partner-sourced revenue (68%) (‘cuz I’m stronger than yesterday 🎙)
- Partner-influenced revenue (60%) (What Britney said ☝️)
- Leads generated by partners (55%)
Quick Tips:
- By now, you’ve shown the results of your partner program. Now’s the time to further develop your partner enablement team — with new hires, materials, and maybe even a certification program.
- With a lot of partners on your plate, consider establishing or iterating your tiering program to help your partners generate even more revenue for your company.
Essential reading for making the most of “Level 3” 👇
- WP Engine Used This 7-Stage “Bow-Tie” Funnel to Increase Agency Partners by 50%. Sales has a funnel, marketing has a funnel, and now partnerships has a funnel, too. Matt Irving at WP Engine explains how his team uses the “bow-tie” funnel to track the entire partner journey.
- 3 Partnerships Team Org Charts (So You Can Plan Ahead for Your Team’s Growth). As your team grows, you’re going to need to make some big decisions about who each new role should report to and why. We gathered org charts from Contentsquare, Workato, and Airship to help you make your next move.
- How Sendoso Empowers its Sales Team to Close Deals 28 Days Faster. Enabling your sales team with partner data is often easier said than done. Here are six ways Carina Shahin at Sendoso gets her team excited about leveraging partnerships to accelerate deals.

Level #4: Supernode
At the 1,000+ employee mark, this stage is all about scaling. Your company can allot more flexibility towards partner-influenced revenue because you’ve proven the impact your partners have on increasing and accelerating deals, ballooning ARR, and bumping up retention rates.
Your partnerships org consists of specialized teams and roles dedicated to each partner program type your organization has and the nuances that come along with each.
At “level 4,” the majority of your peers are held most accountable for:
- Partner-sourced revenue (72%) (💪)
- Partner-influenced revenue (52%)
- Leads generated by partners (48%)
Quick Tips:
- Return to your childlike curiosity as an “experimenter” in the Explorer Stage. You have the resources, buy-in, and headcount to get creative with your strategic partnerships.
- Look to your strategic partners as future acquisitions for your company — or vice versa. Keep the long-term vision in mind as you create shared value that forecasts the growth of your alliance.
Essential reading for making the most of “Level 4” 👇
- Get Off the Partner Enablement Treadmill. Learn how WP Engine’s partner enablement process has helped them grow their agency partner program by 8X in its first two years of operation.
- Get Your Sales Team Excited About Co-Selling With a 50% Faster Time to Close. This three-step framework can help you target the most strategic accounts and close deals faster.
- An Inside Look Into Google and HubSpot’s GTM Strategy for Their Ads Integration. What does a successful co-marketing campaign look like from beginning to end? We compiled all of the co-marketing collateral Google and HubSpot used to increase their feature adoption by 232% in just five months.


