

Track your tech ecosystem’s impact on churn, and you’re 3.6x more likely to have dedicated budget for integrations.
Most partnership professionals believe integrations have a measurable impact on churn, yet more than 50% don’t have the hard data to show it.

Data from the 2022 State of the Partner Ecosystem Report

Data from the 2022 State of the Partner Ecosystem Report
Want more proof? Our tech ecosystem maturity diagnostic revealed a similar story. 71% of those respondents believe their integrations decrease churn, yet only 25% have the hard data to prove it.
This is a problem.
Source: The State of the Partner Ecosystem 2022 Webinar
Knowing how your tech ecosystem impacts churn is key to the success of every other aspect of your tech partner program. Take Freshworks, for example. The business software solution company knows their customers are 30% less likely to churn when they’ve adopted one integration (compared to 0) and 60-80% less likely to churn when they’ve adopted five integrations or more. As a result:
- Freshworks’s customer success managers (CSMs) understand how their tech ecosystem benefits them in their roles, and their CSMs have directly contributed to a 30% increase in integration adoption within one year.
- Integration adoption is a key metric for the CS team’s objectives and key results (OKRs) for 2022.
- Freshworks’s farming sales team (those who expand existing customer accounts) and CS team are excited to leverage their tech ecosystem for upselling and cross-selling because they know it improves customer satisfaction and retention.
- Freshworks’s sales development representatives (SDRs) and solutions engineers (SEs) now actively request resources related to their integrations and position their tech ecosystem as an integral part of Freshworks’s value proposition during the sales cycle.

“From the SDRs to AEs to CSMs who care about churn, upsell, cross-sell — All of them are happy,” says Krishanth Thangarajah, former Head of Global Technology Partnerships at Freshworks.
Below, we cover how the Freshworks team tracks its tech ecosystem’s impact on churn and what you can achieve by prioritizing these metrics.
Gather the Right Data to Track Your Tech Ecosystem’s Impact on Churn
You’ll need to gather some data before you can analyze your tech ecosystem’s impact on churn.
Step #1: Divide your customer base into buckets, according to integration adoption. For example, Freshworks uses the below:
- Customers who have adopted 0 integrations
- Customers who have adopted one integration
- Customers who have adopted 2-4 integrations
- Customers who have adopted five or more integrations
Step #2: Determine how many customers churned within each of the above buckets.
Krishanth recommends using churn data from a particular year. For example: Of those who were customers in January of 2021, “X” customers who adopted one integration churned in December of 2021.
Let’s say 300 customers churned within this timeframe and the breakdown of customers who churned according to the number of integrations they adopted looks like this:
- Out of the 300 customers that adopted 0 integrations, 165 churned
- Out of the 300 customers that adopted one integration, 75 churned
- Out of the 300 customers that adopted 2-4 integrations, 45 churned
- Out of the 300 customers that adopted five or more integrations, 15 churned
How you gather this data depends on your business model, the nuances of your tech ecosystem, and the tools in your tech stack.
Freshworks has its own integration marketplace. Using their marketplace analytics, the Freshworks team can track the number of installs and uninstalls for each integration. On top of these metrics, they can track:
- When the customer installed the integration
- Integration activity per customer (e.g. if the customer is actively using the integration or not, according to the number and frequency of API calls each month)
- Monthly recurring revenue (MRR) for each paid integration per customer
They also track integration installs and other customer health metrics using their customer success software Freshsuccess.
The above data flows into their business intelligence (BI) dashboard, Microsoft’s Power BI. Krishanth and his team can filter their BI reports to show which customers have churned over a specific time period.
The Freshworks team also filters the data on a monthly basis to reveal the number of integrations each customer uses and which integrations their top customers within a given vertical are using. They then share the data with their CS team so their CS reps can learn about the integration use cases and pitch those integrations to customers in similar verticals who have adopted a lower number of integrations.
If you don’t have your own integration marketplace but do have an integration listing in a partner’s tech marketplace, you can track:
- Integration installs via authentication
- Installs and listing engagement, according to the marketplace analytics provided by your partner
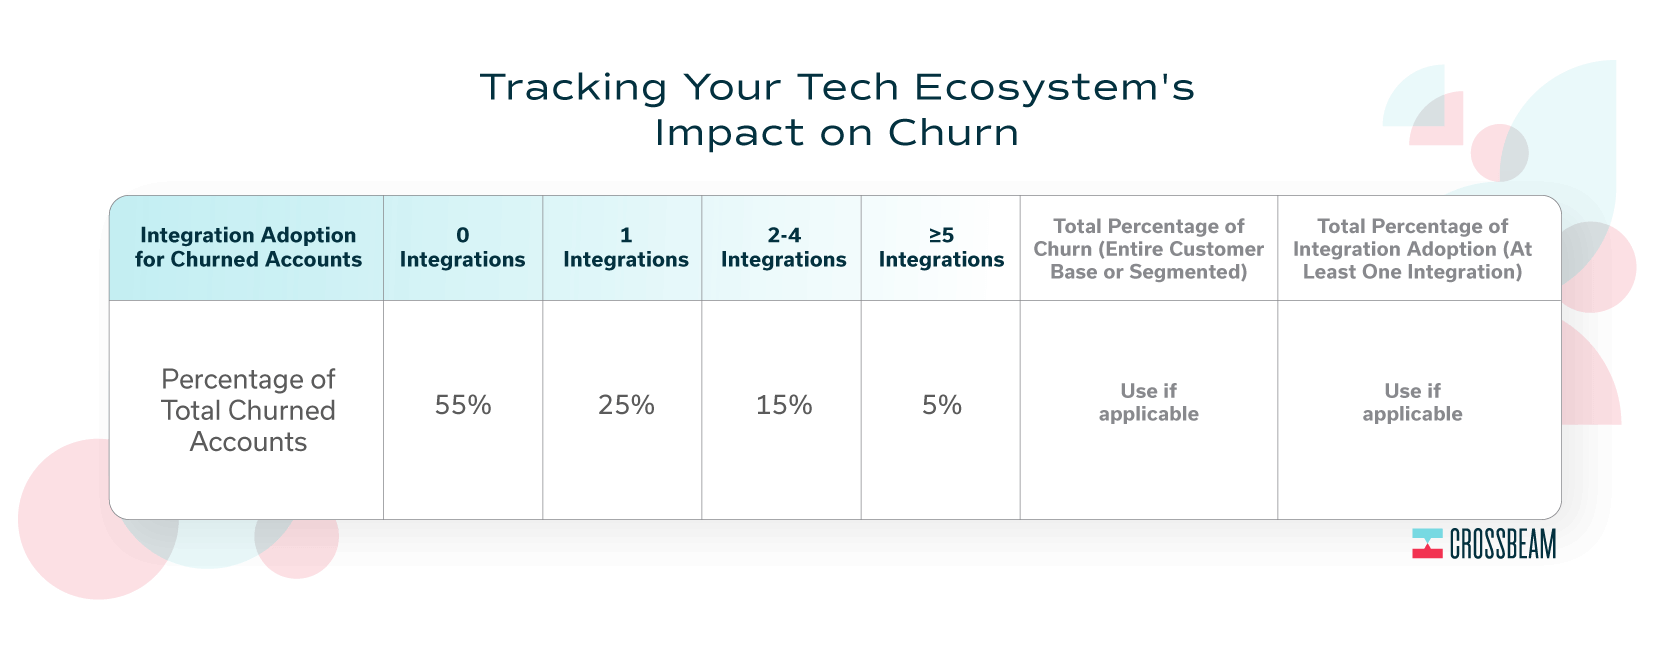
Step #3: Determine the percentage of the total number of churned customers for each integration adoption bucket.
Once you have the answers from Step #2, input the percentage of the total number of churned customers for each integration adoption bucket into the template. Take a look at the percentages below, out of a total of 300 churned customers.
- Out of the 300 customers that adopted 0 integrations, 165 churned (or 55%)
- Out of the 300 customers that adopted one integration, 75 churned (or 25%)
- Out of the 300 customers that adopted 2-4 integrations, 45 churned (or 15%)
- Out of the 300 customers that adopted five or more integrations, 15 churned (or 5%)

Source: Krishanth Thangarajah, former Head of Global Technology Partnerships at Freshworks
Get the Excel template below.
See our example answers in the template below.

Source: Krishanth Thangarajah, former Head of Global Technology Partnerships at Freshworks
Prove Your Tech Ecosystem Directly Contributes to a Decrease in Churn
Now that you have the data, let’s reveal exactly how powerful your tech ecosystem is in reducing churn.
A simple way to show the impact anecdotally:
In our example, the total number of churned customers for a time period of one year is 300. 165 customers who churned had 0 integrations. 75 customers had one integration. 45 customers had between 2-4 integrations. 15 customers had five or more integrations.
The data clearly shows that churn is less when customers use more integrations.
To calculate the change in “likelihood of churn”, according to integration adoption:
You’ll need to calculate the percentage change in churn from one bucket of “number of integrations adopted” to the next. Use “0 integrations adopted” as your baseline for comparison.
Using our example metrics, let’s put this into practice.
Source: Krishanth Thangarajah, former Head of Global Technology Partnerships at Freshworks
The difference between those who adopted 0 integrations (55%) and those who adopted one integration (25%) is 30%. With this data, you can conclude that customers who adopt one integration are 30% less likely to churn than those who adopt 0 integrations.
The difference between those who adopted 0 integrations (55%) and those who adopted five or more integrations (5%) is 50%. Therefore, those who adopt five or more integrations are 50% less likely to churn.

Source: Krishanth Thangarajah, former Head of Global Technology Partnerships at Freshworks
“The percentage is going down. That alone tells a story that the more integrations your customers use, the more [likely they are to] stay with you,” says Krishanth.
If your churn rate increases with a higher amount of integration adoption, then you’re likely not prioritizing developing the right integration use cases or recommending the right integrations for your customers. If the accounts that churned are not actively using the integrations, you could have an enablement issue on your hands.
Put the data into action
Now you have the data. Use it.
Include the data in your monthly and quarterly meetings. Show your leadership team the impact of your tech ecosystem in order to get buy-in for building more integrations or launching go-to-market (GTM) campaigns that require a higher level of time and investment. Also bring these metrics to your quarterly and monthly company-wide or team-specific meetings. The Freshworks partnerships team presented the data to their sales and CS teams, which influenced them to leverage tech partners more during the sales conversation and throughout the customer journey.
Provide your sales and customer success teams with the right resources. As your customer base grows, your integration use cases will need to expand alongside it. Keep your sales and CS teams aware of the most impactful integrations for the types of customers they’re serving. Freshworks supplies its sales and CS teams with education around specific integrations by category to ensure they’re able to provide value for the customer early on in the customer journey.
Krishanth says his team became more excited about their integrations and began requesting the resources they needed. “They started asking us, ‘What are the top integrations for e-commerce clients, what are the top e-commerce apps?’”
For example: Freshworks’s SDRs will gather information about the top integrations for e-commerce customers and include those integrations in additional slides in their sales decks.
“Our CSMs were excited,” says Krishanth. “They said, ‘Okay, great. How can I educate our customers more about the integrations?’”
Segment the data to uncover more insights. Now that you know how to track your tech ecosystem’s impact on churn, segment the data according to business size or customer type. Freshworks looks at how their tech ecosystem impacts churn for mid-market company sizes specifically.
Implement “integration adoption” as an OKR for your internal teams. Once you’re able to show your team how your tech ecosystem benefits them, make the case for partnership-related OKRs to support the partnerships function. Freshworks is in the process of implementing a customer success OKR that encourages CS reps to increase integration adoption among their customers.
Identify more metrics of success. You should analyze your tech ecosystem’s impact on churn, according to those who did churn and according to those who didn’t churn. Get more granular with your metrics by investigating:
- The impact an individual integration has on churn
- Which features for particular integrations are common among customers that didn’t churn
- How active or inactive your customers are for particular integrations and how this contributes to churn
- The percentage of retained customers who have adopted a certain number of integrations and its impact on preventing churn
- Customer success insights and surveys regarding customer satisfaction or dissatisfaction and the impact on churn
- Which integrations are most popular among your retained accounts
- If a particular integration or combination of integrations didn’t exist, would your customers churn?
–


This is a test comment.
This is a longer test comment to see how this looks if the person decides to ramble a bit. So they're rambling and rambling and then they even lorem ipsum.